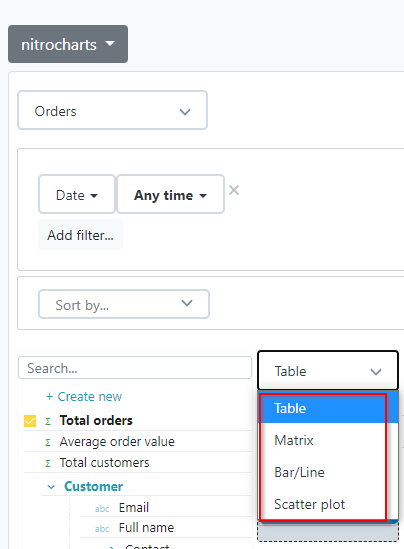
You must choose a visual type for your report:

Table report
Tables are the most commonly used visual type.
- The header row shows the name of each column
- Each column represents a dimension or measure
- Data rows can be sorted by one or multiple columns
- Support multi-level subtotals and grand total
- Possible to add color saturation on a measure (light to dark)
- Possible to add hidden fields for sorting or maintaining row preferences

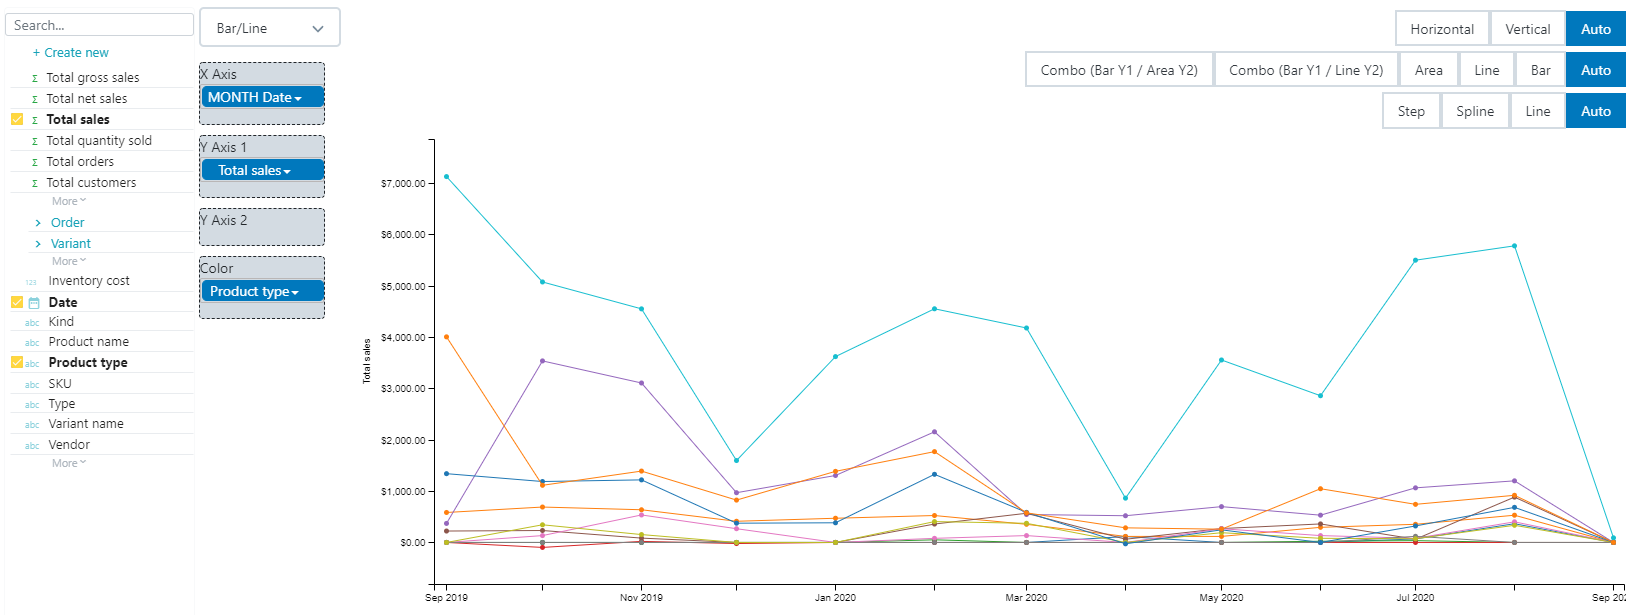
Bar / Line report
Bar charts and line charts are the second most popular visual type.
Line charts are often used to track a metric over time and bar charts are often used to compare different segments.
You can also change the orientation, type (area, line, bar) and even create combo charts.
It is not possible to export bar/line graphs as graphics. Exports in any format will appear as a table report.

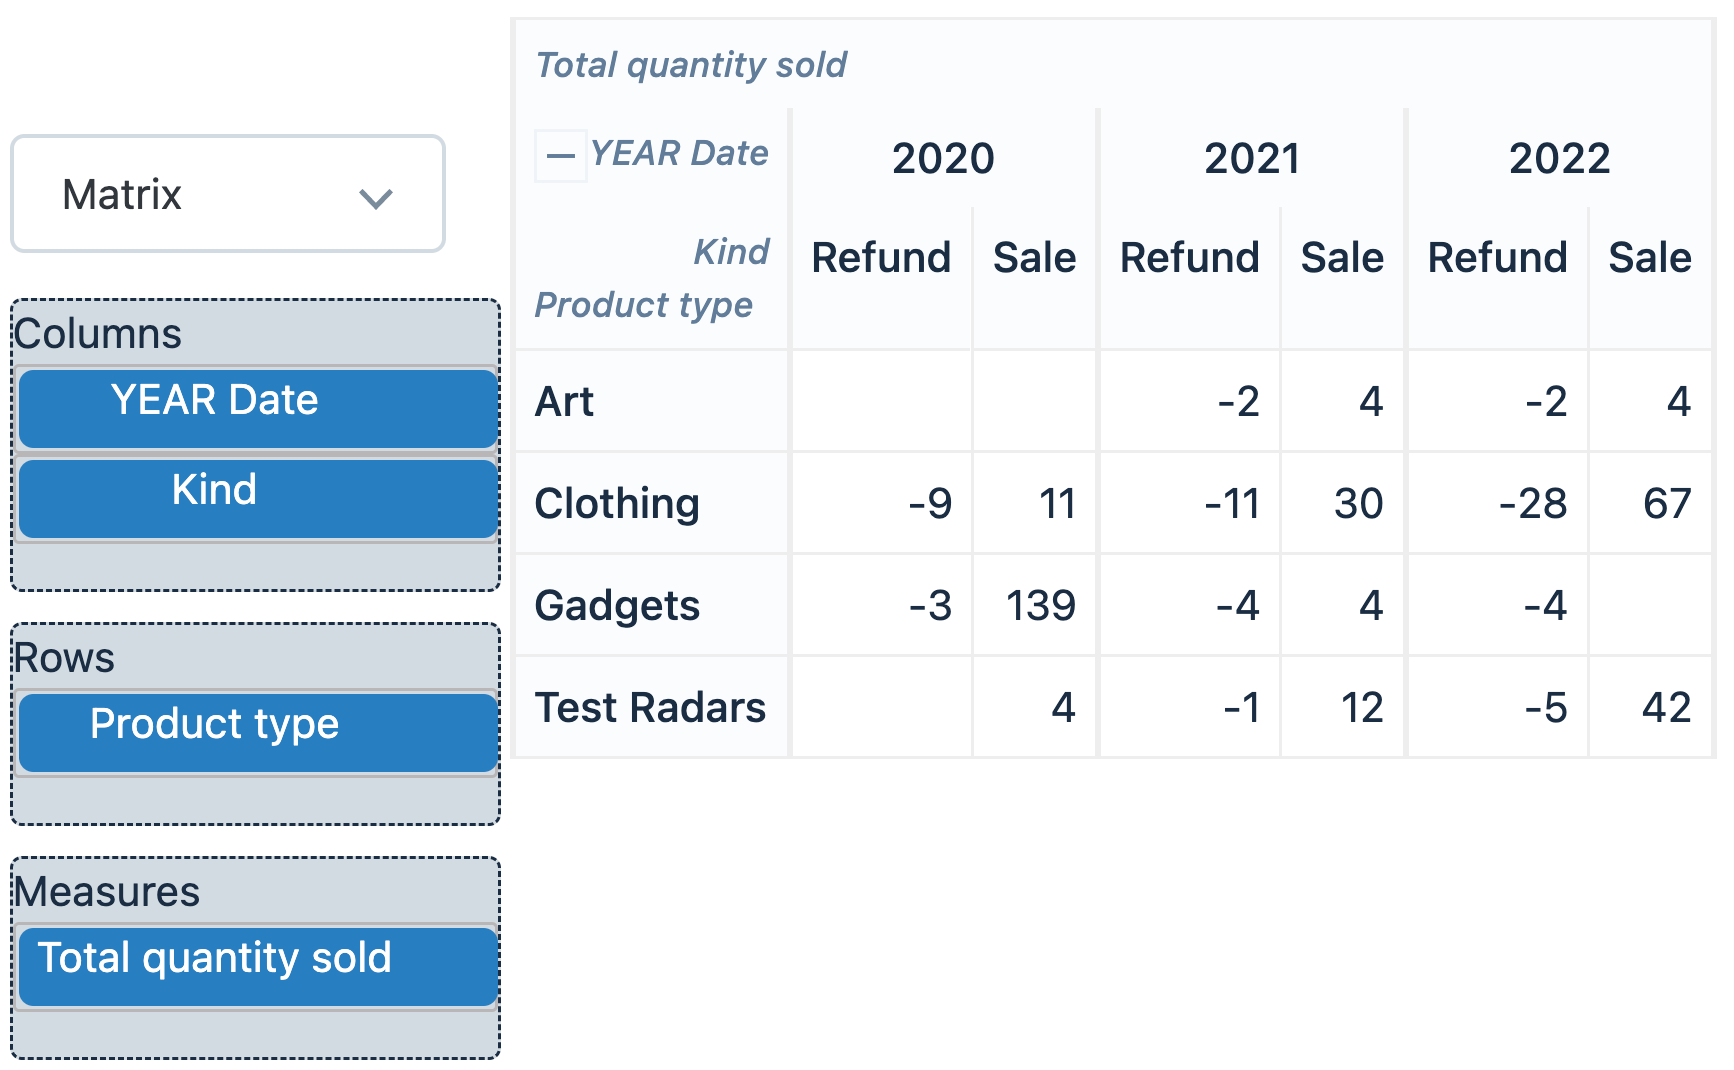
Matrix report
Also known as cross-tab report or pivot table.
Matrix reports have a tabular format, with one or several dimensions on both rows and columns.
The table cells show one or multiple measures.

Matrix reports can have:
- Collapsed columns with detailed data
- Subtotals on selected columns or rows
- Color saturation on measures (light to dark)

Scatter Plot
Scatter plots are rarely used in a business context.
They are useful in scientific domains to visualize the correlation between two numeric variables.
It is possible to use different bubble colors per segment and change the bubble size based on a chosen measure.
It is not possible to export scatter plots as graphics. Exports in any format will appear as a table report.

