logo
HomeApp
Better Reports - Documentation
Getting Started
Connectors and Terminology
Using the app
Navigation Bar
Filtering
Exporting reports
Scheduling reports
Building Reports
Choosing the root entity
Choosing a visual type
Configuring a report
Dimensions and Measures
Hidden cell values
Configuring a table report
Configuring a bar/line report
Configuring a matrix report
Configuring a scatter plot report
Creating/copying reports
Backfilling
Creating Custom Fields
Configuring date fields
Connectors
Shopify
Stripe
Security & Privacy
Billing
Billing and Cancelling a Subscription
Pricing
Schedules & Overages
Contact Us
Better Reports - Documentation
/
Using the app
/
Building Reports
/
Configuring a report

Configuring a bar/line report

Bar / Line report roles
Name
Type
Cardinality
X axis
Dimension
1
Y axis 1
Measure
1 or many
Y axis 2
Measure
0 or many
Color
Dimension
0 or 1
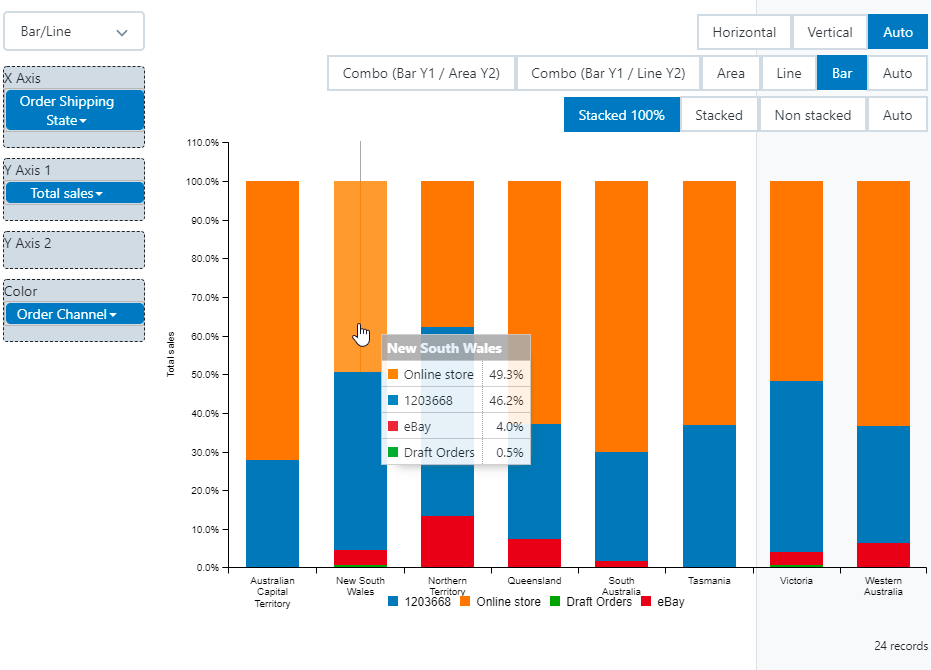
Use bar charts and line charts to visualize your data.
  • Assign a dimension to the X Axis, typically either a date field or a text field.
  • Assign one or several measures to the Y Axis 1 and 2.
  • Assign a color dimension to create a separate series for each value (optional)
Image without caption
Configuring a table report
Configuring a matrix report

Powered by Notaku
Helpful?
Share