Table report roles
Name | Type | Cardinality |
Dimensions | Dimension | 0 to many |
Measures | Measure | 0 to many |
Row color saturation | Measure | 0 or 1 |
Hidden field | Dimension | 0 to many |
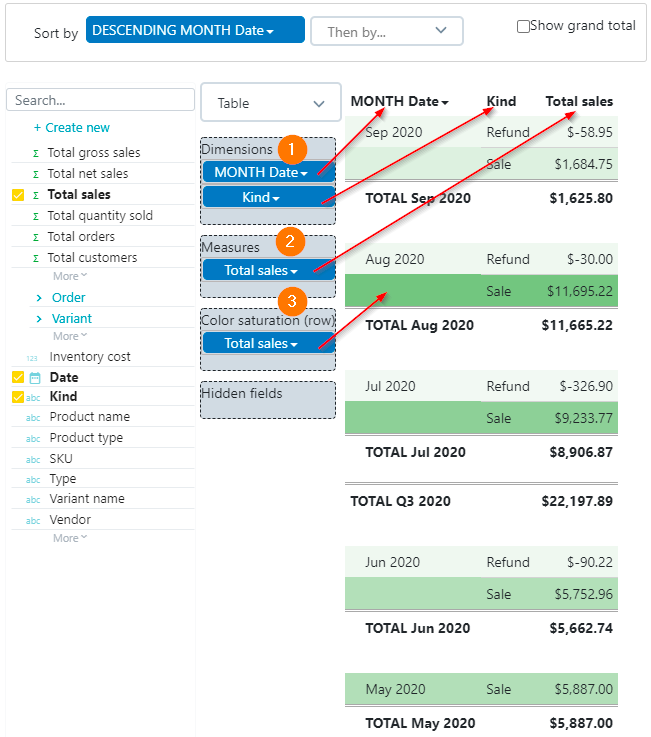
Use table reports to show data in a tabular format, with dimension columns (1) on the left side of the table and measure columns (2) on the right side of the table.
You can also assign a measure that determines the Color saturation of the row (3).
A linear interpolation is applied from the lowest value (white) to the highest value (dark green).


Sorting, subtotals and grand totals
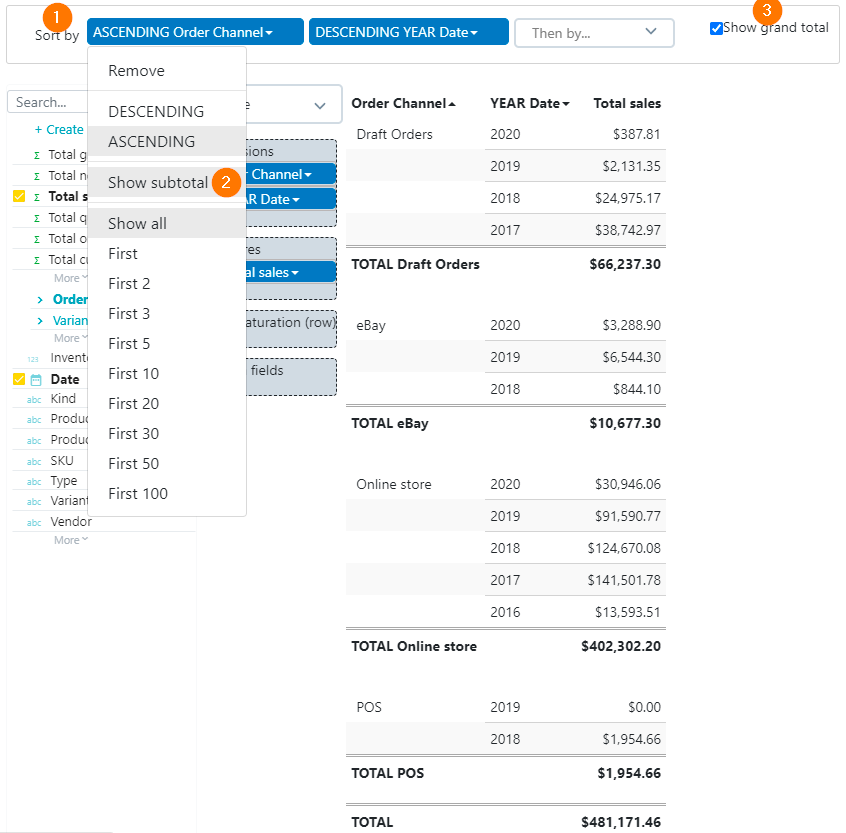
You can sort table reports by one or multiple fields (1), and show a subtotal for each level.
For each sorted field, you can choose whether to display a subtotal (2).
Date fields can display a subtotal at several levels, such as month, quarter and/or year.
A checkbox is also available to display a grand total at the very bottom of the table (3). This will only appear for reports that have at least 1 measure applied.

